Passive Design Approach to the Learning Environment
- By Mike Dieterich
- 10/01/16
PHOTOS PROVIDED BY MIKE DIETERICH
Passive design strategies reduce upfront costs, operating expenses and
required maintenance. They are as intelligent as they are cost effective. Passive design features, like additional
insulation, light shelves, shade walls and innovative heating/cooling design reduce the amount of energy that an
HVAC system needs in order to adequately heat or cool a space. Less demanding HVAC systems have lower upfront
installation costs and are cheaper to operate. Money saved can then be put towards adding even more energy saving
features to a building. A return on investment can be calculated to illustrate the value of an energy efficient system.
This article features research from the D.C.
Public Schools (DCPS) Modernization Program. This is a
multiyear study that will be revisited as new technology is
developed. Retrofitting and building measurements were
used to establish benchmarks. After being commissioned, optimization
research was conducted to enhance performance
and optimize efficiency.
The DCPS Modernization Program used energy audits and
the Collaborative for High Performance Schools (CHPS) Operational
Report Card (ORC) to establish its data points. The ORC
evaluates a learning environment’s performance by measuring
its indoor air quality, energy efficiency, visual quality, acoustics,
thermal comfort, water conservation and waste reduction.
Indoor air quality measures an interior environment’s
temperature, relative humidity and its carbon dioxide (CO2)
and carbon monoxide (CO) levels, in parts-per-million
(ppm). CO and CO2 levels are compared to those found in the
surrounding outdoor environment.
Energy Star’s Portfolio Manager was used to measure
and compare each school’s energy consumption to a national
standard. Our analysis collected energy consumption data at
15 second, sub-metered intervals, which helped us determine
the spikes, baseloads, peak loads and start/finish times
for each piece of equipment. By adjusting start times and
temperature points, we reduced energy consumption by an
additional 20 percent.
Energy audits also use thermography to discover air
leakages. This is done by assigning an estimated R-value to a
building’s envelope. Thermographs of the envelope are then
taken and analyzed to determine the relative temperature
differences (hot vs. cold) of an envelope’s features. Significant
temperature differences indicate leakage points. Common
leakage points are around window and doorframes, hollow
wall cavities, attic spaces and other holes cut into the
envelope. After being identified, leakage points are properly
insulated and sealed.
Our project measured light levels at desk height, in nine locations
throughout each classroom. Measurements were taken
three times during a school day to determine how the light level
changes in a classroom. Levels are measured in foot-candles
(FC). Acceptable levels are between 35 and 50 FC. Most spaces
were over lit or inappropriately lit for their purpose. Changes
made to light distribution and fixture type cut back on the
number of lights that each building needed by 30 to 40 percent.
The two acoustic properties we studied were background
noise and sound insulation. Background noise is the sound
level in a room in which no sound is intentionally made.
Sounds from an HVAC system, mechanical equipment and
the outdoors contribute to a room’s background noise level.
Learning becomes difficult when levels breach 45 decibels.
Measurements should be taken with and without the HVAC
system running to determine the amount of background
noise it contributes.
Sound insulation is the amount of sound that is transmitted
between adjacent spaces. It is measured between a classroom
and a hallway, and between two adjacent classrooms. Proper building design results in a reduction of at least 40
dBA between a classroom and a hallway and at least 45 dBA
between adjoining classrooms.
Water use is measured by counting the number of fixtures in a
building and then observing each fixture’s flow rate. This metric
helped us determine whether high-flow fixtures needed to be replaced
by ultra-low flow fixtures. In Washington, D.C., storm water
management is key to site success. D.C. requires all water from
a 1.2-inch rain event to be reusable. This can be accomplished via
green roofs, greywater toilet flushing, and bio swales.
To determine waste production, we recorded the amount
of waste that each school sent to a landfill, recycled, or composted.
Our analysis enabled more appropriately sized waste
receptacles to be installed and strategically placed to better
accommodate the creation of a zero-waste school.
Occupant satisfaction is an overlooked, but equally important
metric. To measure satisfaction, a survey, with questions
relating to each of the aforementioned categories, was issued.
If over 20 percent of responses to questions about a specific
category indicated dissatisfaction, we revisited our approach
to that category. (See chart 1 below.)
| Energy Conservation Measure |
Average Cost by School |
Cost/SF |
Payback |
Value |
Building Automation
System - BACNet |
$15K-50K |
NA |
9 months |
20 percent reduction on annual energy costs, in the sprint to
savings program. |
| Envelope Enhancement |
$47.5K |
$0.96 |
2.7 years |
Savings, on average, of $250,000 over the life of the building. |
| LED lights |
$1.25M |
$6.38 |
4 years |
LED lights are 30 percent more efficient, and last 6 times
longer, reducing maintenance. |
| Daylight Controls |
$424K |
$2.45 |
4 years |
Accurate light levels in academic spaces provide an
optimal learning environment. |
| Lights Fins- Shading |
$280K |
$varies |
10 years |
Reduced HVAC costs, size and demand. |
| Greywater Reuse |
$540K |
$2.50 |
10 years |
Have Stormwater credits and do not have to pay a fee for not
meeting the requirements. Reduced Watershed impact- meets
DDOE-EPA requirements. |
Money saved by following our model was put towards the
installation of additional, passive energy saving features in
each building, which further reduced HVAC demands and
their consequential costs.
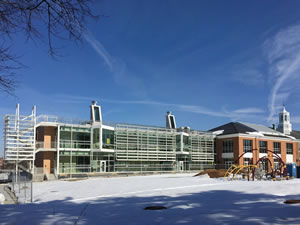
On page 16 is an image of Powell Elementary School.
During the addition a shading devise was installed as a
passive solar design adding 10 percent in energy savings.
An East West Building Orientation saves five percent. The
solar chimneys reduce energy consumption in excess of 10
percent, depending on weather conditions. Low-flow plumbing
fixtures decrease water usage by 50 percent, saving $3,007
($5.60/1,000 gal). The value of these features becomes clear.
This also becomes part of the curriculum where teachers can
use the school building for real world lessons in mathematics,
science, engineering, art, and writing.
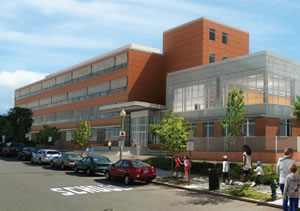
Watkins Elementary School, image below, incorporated a
shade wall into the retrofit of
Cost of Shades (50 percent): 10,750 square feet x $25/square foot = $268,750
Savings in HVAC Initial Cost: 28 tons x $8,000/ton = $224,000
Savings in HVAC Operating Cost: 28 tons x 1,500 hours per year x 0.75 kw/ton x $0.15/kwh =
$4, 725/year in electricity.
- Total Net Savings= $41,495
- Savings to Investment Ratio (SIR) = 1.93
- Annual Internal Rate of Return (AIRR) = 5.74 percent
- Simple Pay Back (SPB) = 10 years
- Life Cycle Emission Reduction: 932 metric tons C02; 3 metric
tons S02; 1.4 metric tons NOx
PHOTOS PROVIDED BY MIKE DIETERICH
The planning process has been augmented such that
passive design features are now discussed at the outset. The
short-term cost of implementing these features is justified by the long-term savings they yield. The sustainability, via passive
design, approach has been quantified and it demonstrates
drastically decreasing operating costs.
This is a two-step process. The first step incorporates sustainability
into the design, as discussed, reducing the overall
baseline of energy consumption. The second step comes down
to how a building is operated. This is best shown through the
Sprint to Savings competition run by Jamie Donovan using
building optimization planning and management.
The Sprint to Savings energy competition challenged participating
DCPS schools to reduce their electricity during the fiveweek
competition period (Dec. 1 to Jan. 4). Their performance was
compared to a weather normalized baseline period (Oct. 15 to Nov.
30), since the primary goal of the competition is occupant engagement
and education, for a fair and effective competition design.
Using data from the competition, we compared the average
daily kilowatt hour (kWh) consumption during winter
break compared to daily consumption during the first three
weeks of December. As a whole, the 25 schools included in the
competition reduced kWh consumption during winter break
by about 17 percent compared to the preceding three weeks.
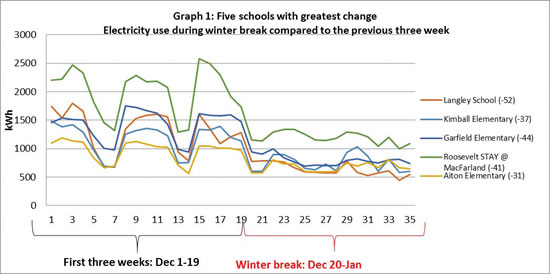
A further analysis of five schools reveals that they were successful
in turning things off during unoccupied periods during
the competition period. As graph 1 shows, these schools had
significant reductions during each weekend during the competition
and for winter break. The well-defined peaks between
days 1-5, 8-12 and 15-19 represent occupied weekdays when,
consumption would be at its highest. The troughs — day 6-7, 13-14 — represent the weekends.
The curves flatten out at day 20
with the beginning of winter break
and remain low. These curves are
exactly what we like to see.
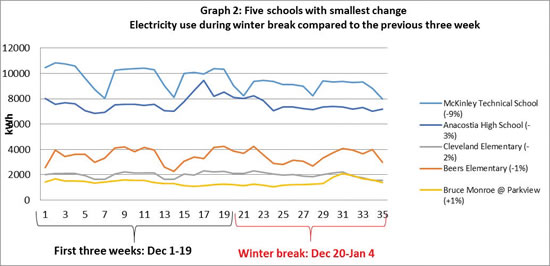
In contrast with the top five
schools, (see graph 2 above),
the five schools at the bottom of
the table were less successful in
shutting down over winter break.
By looking at the load profiles
of these schools and analyzing
the data, these buildings are
consuming electricity at nearly
the same rate during weekends
and holidays as they are when the
building is fully occupied during
the week. This is particularly true
for Cleveland and Bruce Monroe
@ Parkview, indicated by electricity
use curves that are essentially
flat with no troughs or peaks.
The take away is: a) improving
shut down performance during
unoccupied times and; b) implementing
tighter HVAC scheduling
on a permanent basis. If the bottom
five schools realized electricity
reductions over winter break
consistent with the competition
average — 17 percent, the five
schools would have reduced their
spending by $8,012, or $5,718
above their actual spending.
Making permanent scheduling
changes at these five sites presents
a significant saving opportunity. A
20 percent reduction would save the
city $210,000 per year — or $1 million
over five years — in electricity
costs. A 10 percent reduction would
achieve a savings of $118,965 per
year — or nearly $600,000 over five
years — across these five facilities.
The 20 percent reduction target
is not arbitrary. Implementing
scheduling/controls changes at
facilities that currently have no or
limited schedules in place should
yield at least a 20 percent reduction.
This article originally appeared in the issue of .