January 1st, 2019
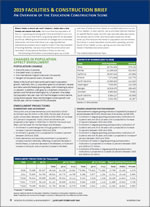
A brief overview of the trends in facilities and construction based on available data and a survey of our readers. Information includes the trends in population and enrollment, the trends in overall education construction spending, and the results of our reader survey.

July 1st, 2018
This special section is designed as a reference guide to help school administrators make the most of their resources by helping them evaluate suppliers and examine the range of options available. It contains information about products and services from suppliers to the education market, listings of trade associations that serve our industry and an index of architectural firms that were featured in the 2017 Education Design Showcase.

April 20th, 2018
What can empower your team and help transform your operations for the better? Data. Using data to your advantage can make all the difference in getting the results your institution is after. See how your industry peers reported on the current state of their operations and get insight into how you can use the information to improve yours in Dude Solutions' 2018 Operations Health Index.
February 1st, 2018
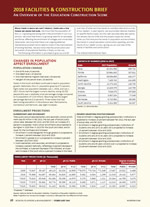
A brief overview of the trends in facilities and construction based on available data and a survey of our readers. Information includes the trends in population and enrollment, the trends in overall education construction spending, and the results of our reader survey.
July 1st, 2017
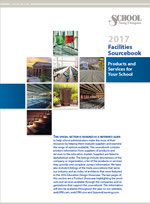
This reference guide is designed to help school administrators make the most of their resources by helping them evaluate suppliers and examine the range of options available. This sourcebook contains product information from suppliers of products and services to the education market, and listings of the trade associations that serve our industry and an index of architects that were featured in the 2016 Education Design Showcase.
February 1st, 2017
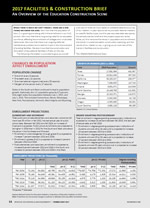
A brief overview of the trends in facilities and construction based on available data and a survey of our readers. Information includes the trends in population and enrollment, the trends in overall education construction spending, and the results of our reader survey.
February 1st, 2016
Construction and reconstruction of educational buildings — schools and colleges combined — totaled about $24.5 billion in 2015. School districts throughout the United States put $12.9 billion worth of construction in place during 2015.
February 1st, 2015
More than $14 billion worth of school construction was put in place in 2014, a five percent increase over the previous year and the fourth year in a row that spending has increased.
February 1st, 2014
Total school construction rose again in 2013, with more than $13 billion dollars of construction taking place.
February 1st, 2013
School districts in the United States spent just under $13 billion on construction projects completed during the 2012 calendar year. Only $6.2 billion of that was spent on new schools, accounting for 47.6 percent of the construction dollars. The balance was split between additions to existing buildings and retrofit and modernization of existing structures. This is the first time in 12 years that spending for new buildings was less than spending on existing ones.
February 1st, 2012
In 2011, $12.2 billion worth of school construction was put in place. That's a lot of money, but put it in perspective. From 2000 through 2008, school construction averaged more than $20 billion annually. The demand for school space and improved facilities has not lessened - the number of children schools serve continues to rise - but, as a consequence of the 2008 recession, combined with the anti-tax sentiment it spawned, the money has dried up.
February 1st, 2011
Total school construction fell in 2010, but even so, more than $14.5 billion dollars of construction was put in place making schools one of the largest construction markets in the United States. Read about this and more in the 16th Annual School Construction Report.
February 1st, 2010
Last year’s projections proved to be very accurate. School construction in 2009 fell 16 percent from one year ago, to just $16.4 billion, the lowest total for school construction since 1998. The 15th Annual Construction Report gives the details and a synopsis.
February 1st, 2009
School construction remains high, but not as high as it has been over the last eight years. Projections for the future (projects expected to be completed and/or started in 2009) show a significant decline. Capital budgets may be in place, but the economic hard times that are affecting all of us and forcing cuts in many local school programs are also having an effect on construction planning. How much, and to some extent where and why, is the focus of this report.
February 1st, 2008
School construction completed in 2007 — including new buildings, additions to existing buildings, and major retrofit of existing buildings — totaled almost $20.8B, a significant increase over the $20.1B spent on construction completed in 2006.