Built to Last
ER ratios per student affect viability.
- By DeJONG-RICHTER
- 12/01/13
“Best practices” is a term often used but not always clearly defined. In K-12 financial matters, as in others, one can gain insight into what might constitute best practices by analyzing data from districts nationwide. When our firm heard that a district closed its doors in May 2013 because it couldn’t make payroll, we began an inquiry into what might indicate a district’s financial health. Our research resulted in two key findings:
- District-wide enrollment is a core indicator of financial wellbeing.
- A district’s student expenditure/revenue ratio is likely a key indication of financial viability as well, even when controlling for enrollment.
We looked at school operating expenditures per student, operating revenue per student and student enrollment data, nationwide, to determine what measures appeared to indicate a district’s financial viability and what appeared to predict closure or consolidation.
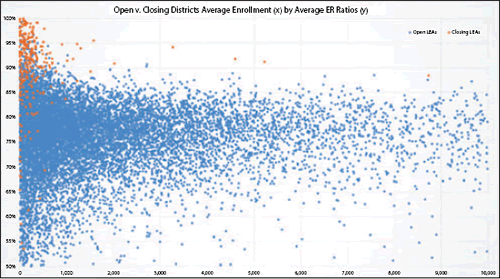
We found districts that remained open between 2001 and 2008, spent on average 82.62 cents per dollar for each student (operating expenses only), with a mean enrollment of 3,401 students. Districts (or Local Educational Agencies, LEAs) that closed or consolidated during this same timeframe averaged 92.17 cents expended per dollar revenue, with a substantially lower mean of 391 students.
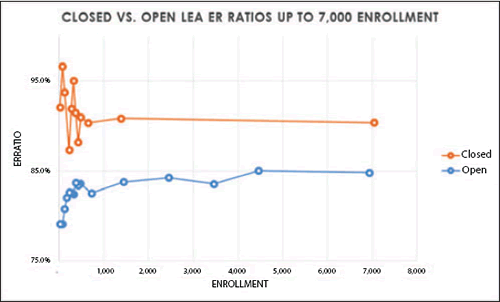
While it came as no surprise that low enrollment appears to be a primary driver of closure or consolidation, the data strongly suggests that LEA expense/revenue (ER) ratios per pupil impact viability independent of enrollment. ER scores vary between open and closing LEAs of similar sizes, not only by raw percentages, but also by behavior as districts grow. In general, ER scores for open LEAs trend slightly higher as a district grows from single-digit enrollment through the thousands before leveling, while closing districts show ER scores that swing wildly by comparison as enrollment grows.


It would seem logical to suppose that in addition to the concept of minimum viable enrollment for a school district, the ratio of per-student expenses to revenue is a complementary indicator of viability. The data seems to suggest enrollments above 1,000, and closer to 3,300, place a district in a strong position, provided ER ratios are kept below or at least between 83 and 93 percent, depending in part on district size.
Small districts, below 400, can remain viable provided they have higher revenues and/or lower expenditures per student than their larger counterparts. Furthermore, the data strongly suggests that state education agencies’ policies directly impact districts’ open/closure rates, as state policies govern the number of districts allowed within the state. States without closures in our study averaged 1,000 more students per LEA than the national average.
We welcome comments or questions regarding this study, and hope that the data analyzed will provide some help to districts when assessing their current financial positions relative to enrollment.
To see this report in its entirety or to review the data behind the report, please contact David Sturtz at [email protected], and/or download the report at dejongrichter.com.
This article originally appeared in the School Planning & Management December 2013 issue of Spaces4Learning.
About the Author
DeJONG-RICHTER is recognized as one of the foremost educational facility planning firms in the United States, having worked in 43 states and provinces planning educational facilities. During the past 19 years, DeJONG-RICHTER and its affiliates have completed over 1,500 enrollment projections, 260 Educational Specifications for elementary, middle, and high school facilities, and 200 Facility Master Plans for urban, suburban, and rural communities. DeJONG-RICHTER has helped more than 1,000 school districts position and empower their communities to develop superior learning facilities.